Everyone knows the scenario, you want to analyze an issue with your server or local computer but where to find all those log files?
In the following tutorial, we are going to analyze specific log files in Linux and logs in the Windows Event Viewer. An additional chapter will go through the log analysis via Systemd.
Linux log files
Unfortunately, it is quite different from distribution to distribution, in which information can be extracted from specific log files. In the following, we will analyze the log file structure of Debian 8 and CentOS 7.2. The first location to look for log files should always be /var/log/. Depending on their configuration, Apache, Nginx or similar applications write log files to this folder too. System log specifications and locations can be found in the file /etc/rsyslog.conf.
Debian 8:
- /var/log/auth.log
Logs of successful and failed authentications to your system can be found in this log file. It is also logged when a user invokes commands via sudo.
- /var/log/messages
This file contains log entries of general system information, amongst others, you will also find the system upstart logs.
- /var/log/dmesg or dmesg
The kernel ring buffer can be read with dmesg. You will find information about the system upstart, runtime kernel module messages, and many further messages according to the hardware and software of your system. By default, dmesg shows the full ring buffer. However, the output can be customized by adding specific parameters. A thorough documentation can be found on the manual page (man dmesg).
- /var/log/syslog
This is one of the most important log files in general. Every Linux process is free to log into the syslog by implementing the syslog interface. It also logs the system upstart and executes cron jobs.
CentOS 7.2:
As the log file structure is quite similar to the one of Debian 8, we will just mention the differences.
- /var/log/secure
This log file is the equivalent of/var/log/auth.log in Debian systems. All kinds of authentications are logged here.
- /var/log/messages
There is no separation of /var/log/messages and /var/log/syslog in CentOS, all system logs of processes that implement the syslog interface can be found here.
- /var/log/cron
Cron specific log files are not part of the syslog as in Debian. They can be found in the above-mentioned file.
Log analysis via Systemd
Systemd is the standard Init system of nearly all major Linux distributions today. Since at least April 2015, when Debian and Ubuntu switched to Systemd, every Linux administrator or user has been in touch with Systemd. As Systemd is a complex system, we will only take a look at the log analysis functionality provided. Every process in Systemd is identified as a unit. All active units can be shown via the following command:
systemctl list-units
When appending the parameter --all, this command also shows all inactive units.
Logs being created by Systemd are managed in the so-called Journal. These logs can be accessed via the journalctl binary. If journalctl is called without any parameter, it will print out the whole Journal. However, it is also possible to output the log entries of specific units only. In the following example, we are going to analyze the log files of the Apache web server.
journalctl -u httpd
It is also possible to restrict the output with the parameters --since and --until.
journalctl -u httpd --since "2016-11-01 20:00:00" --until "2016-11-03 20:00:00"
The above command will output the Apache log entries between 2016-11-01 20:00:00 and 2016-11-03 20:00:00. It is also possible to use keywords like "today" or "yesterday".
You can also output the log files of more than one unit at the same time. In the following example, we will output all Apache and Nginx log entries which have been logged since yesterday.
journalctl -u httpd -u nginx --since yesterday
If the parameter -f is used, all desired log entries are shown in real-time.
The above was only a slight view into the possibilities of journalctl, there are several other useful features which are described on the manual page (man journalctl).
Log analysis via Windows Event Viewer
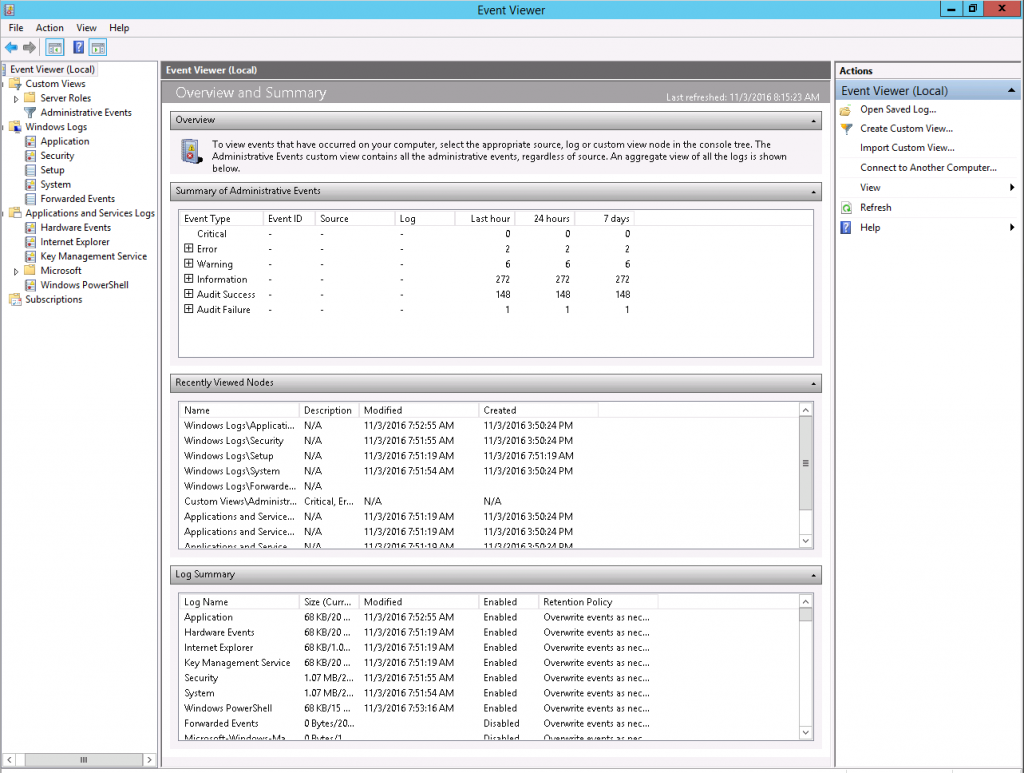
In the above picture in the left navigation you can see the entry "Windows Logs". The following entries are the most important.
- Application
This entry will show the events of locally installed applications.
- Security
Here you can see successful and failed login attempts.
- System
This entry logs operating system internal events and errors.
Via the entry "Custom Views" -> "Server Roles" -> "Remote Desktop Services" you can see RDP-related events and errors.
Potential hardware issues can be identified via "Application and Service Logs" -> "Hardware Events".
Useful for error analysis can also be the overview which can be seen via "Overview and Summary" -> "Summary of Administrative Events", which provides a summarized overview of the system status in general.
